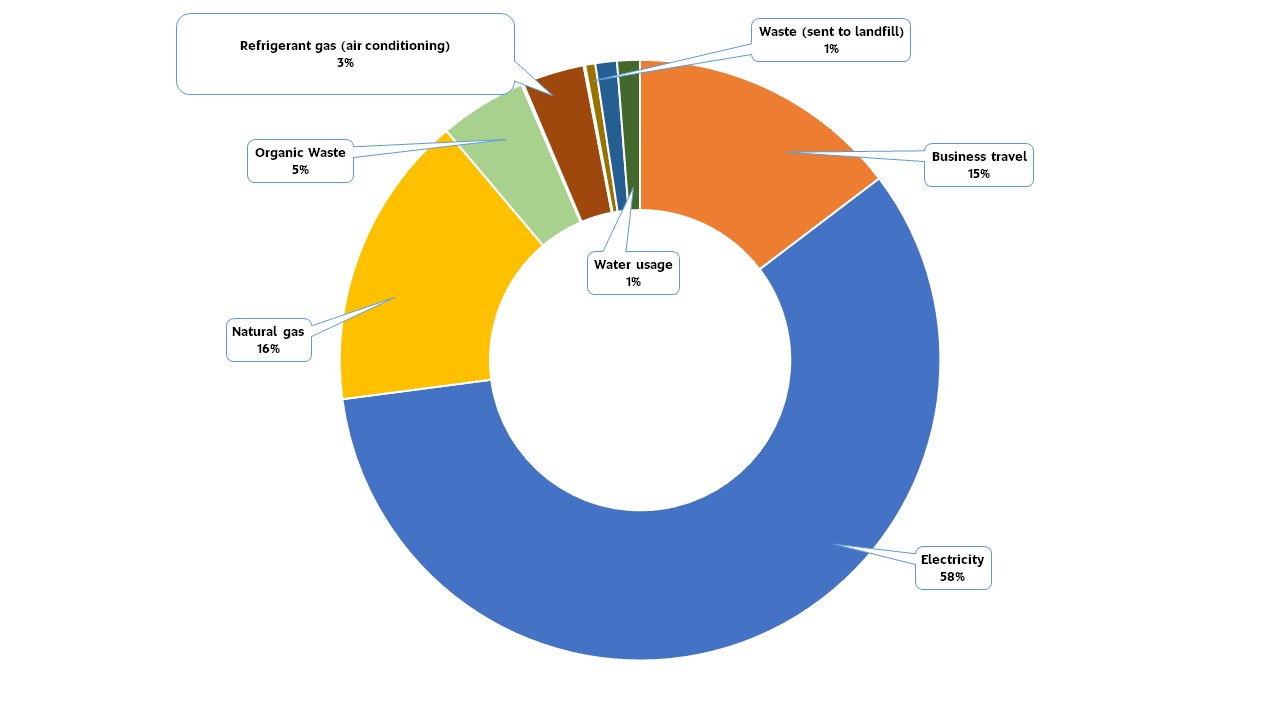
UniSA’s current carbon emissions profile is depicted below. 74% of UniSA’s carbon emissions are caused by energy (electricity and gas) consumption, with over half being caused by electricity consumption alone.
In February 2009, the ATN announced a joint commitment to reduce Scope 1 and 2 carbon emissions by 10% of 2007 levels by 2012/13, and 25% by 2020/21.
Due to UniSA's relatively low carbon emissions in comparison to its ATN partners, our target was to reduce Scope 1 and 2 carbon emissions by 6% of 2007 levels by 2012/13, and 15% by 2020/21. A 2021 carbon emissions audit identified that UniSA had achieved a 42% reduction over the period (2007 – 2020/21).
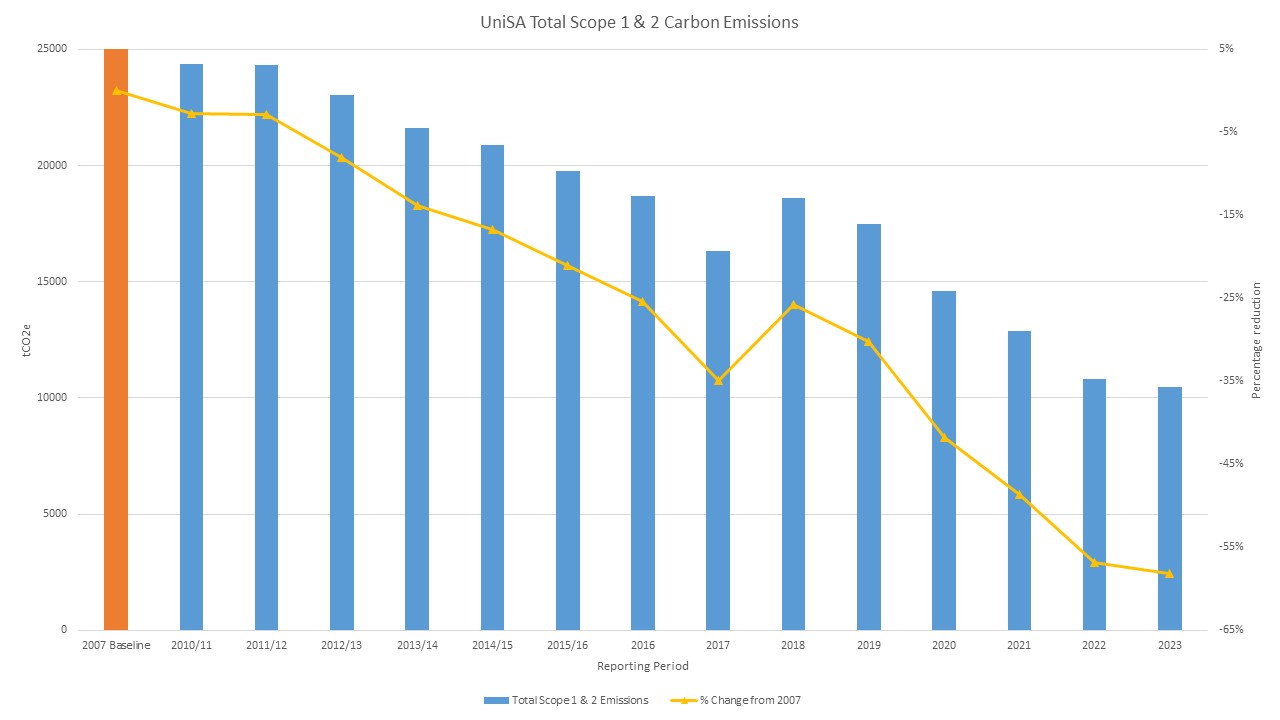
*Total consumption expanded in 2018 due to the completion and occupation of the Bradley Building and Pridham Hall.
UniSA’s carbon emissions management strategy has focused on reducing electricity consumption, with the dual benefit of reducing costs. Prior to 2010 UniSA’s principal strategy was the introduction of push button lighting and air-conditioning controls in all general areas such as teaching and meeting spaces.
Further demand management strategies were implemented in 2012 which included installing:
In 2018 UniSA committed to installing circa 2MW of Solar PV at Mawson Lakes and City West campuses. Following a Post Implementation Review in 2020, the Solar PV was found to have reduced UniSA’s scope 1+2 carbon emissions by circa 9%.
UniSA benchmarks exceptionally well against other Australian Universities regarding its carbon emissions.
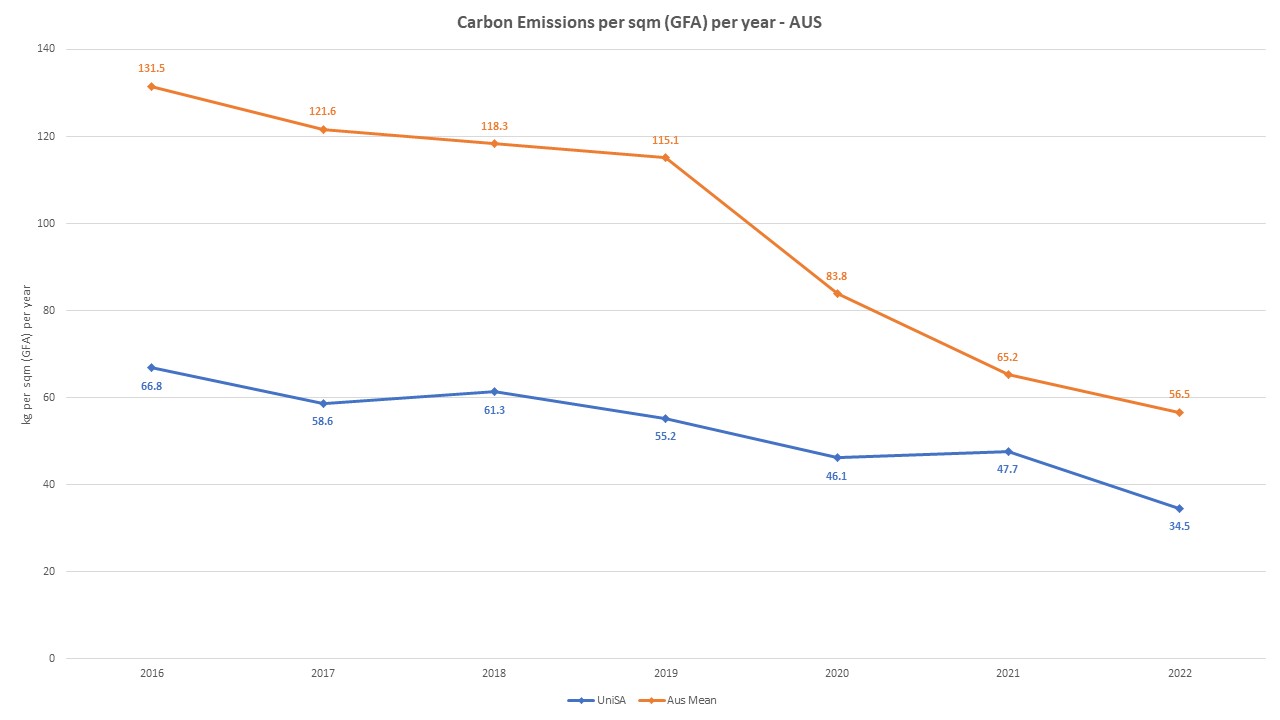
*Source: Tertiary Education Facilities Management Association Benchmarking Data
Please contact us if you would like more information on individual campus or building energy consumption.
Check out the links below or send us your ideas.
Report faults including leaks ASAP via the Maintenance Request online tool.